

Scientists spent decades trying to figure out why the glaciers on Greenland were melting. Sure, temperatures all over the world are rising due to climate change, but that didn’t explain the alarming rate at which some glaciers were vanishing.
Little by little, it became clear that warmer currents from the Atlantic Ocean were a major culprit. The warmer ocean water sloshes slowly against the base of the glaciers, gradually eating away at the ice, which then slips away into the ocean as fresh water.
But why is it that warmer water is reaching the bases of the glaciers at some locations? The answer can be found at the bottom of the ocean.
Only 20% of the entire ocean floor of our planet has been mapped. That means that over half of the surface of our planet remains uncharted, and we have hardly any idea what the ocean floor looks like in sufficient detail or what kinds of organisms are living there.
What little we do know about this deepest, darkest part of our planet offers a clear indication of what treasures may still lie hidden in the depths.
For example, the tallest mountain on Earth – Hawaii’s Mauna Kea, 10,203 metres in height measured from base to peak – is 80% under water. (Mauna Kea soars high by any standards; the dormant volcano measures 4207.3 metres from sea level to peak, making it nearly as tall as the highest peaks of the Alps.) There may be more mineral resources at the bottom of the ocean than there have ever been on land. And many of the deep-sea creatures that we do know about can live to be hundreds or even thousands of years old.


How mapping the seafloor saves lives
But there are other reasons to map the ocean floor. The seabed is crucial in our fight against climate change and could potentially help us predict natural disasters.
Martin Jakobsson, professor of marine geology and geophysics at the University of Stockholm, is keenly aware of this rich source of knowledge. He has spent several decades mapping the ocean floor around Greenland, the North Pole and the North Atlantic Ocean.
First and foremost, the shape and ruggedness of the seafloor terrain influences the direction and speed of ocean currents, Jakobsson explains. For example, ocean currents in the northern waters play a decisive role in how fast Greenland’s ice sheet is melting. “Without a map of the seabed, it becomes almost impossible to predict the scope of the warm currents that are melting the glaciers from below in Greenland.”
Mapping the ocean floor makes it easier to predict the impact of tsunamis
Bit by bit, pieces are being added to the map. The mathematical models of the melting glaciers are becoming more and more detailed.
Mapping the ocean floor also makes it easier to predict the impact of tsunamis. Jakobsson believes that could save human lives. “When a large earthquake occurs in the ocean floor, it moves the seafloor which in turn sets large waves in motion.”If the seabed is almost completely flat, generated tsunami waves move across it rapidly. But an underwater mountain could change their direction and slow their speed.
In addition, mapping the ocean floor helps predict the development of sedimentary deposits. Sea currents carry sediment over the seafloor. Where this mixture of sand, silt, clay, and biogenic sediments from corals, shell fragments and other biological remains is deposited along the coast or remote parts of the ocean is greatly influenced by the seafloor shape. This may sound insignificant, but sediment is an essential part of our protection from the rising seas. Sediment is what forms our dunes and beaches. Without sedimentary deposits, coastal areas would be flooded in no time. To know if there is a sufficient supply of coastal sediment, you need to know what the seabed looks like.
The big question is: how on earth do you visualise such a huge surface area?
Most topographical techniques do not work in the ocean
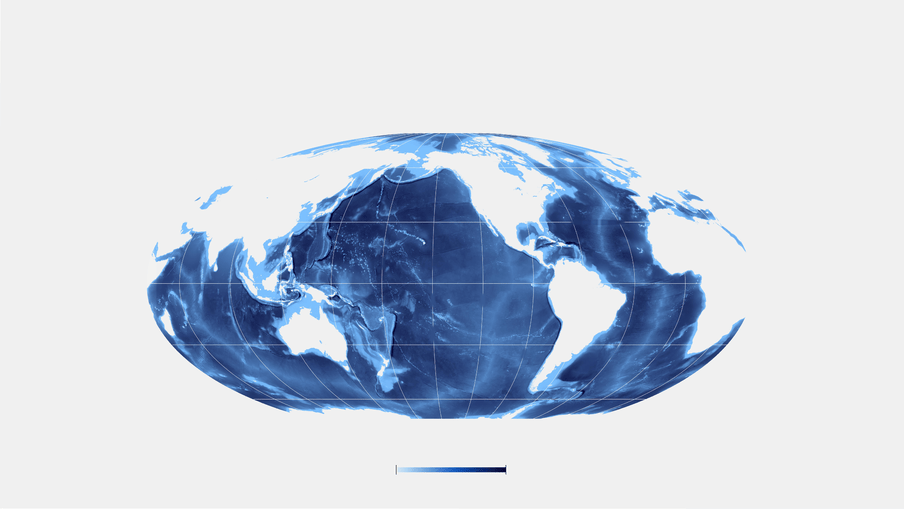
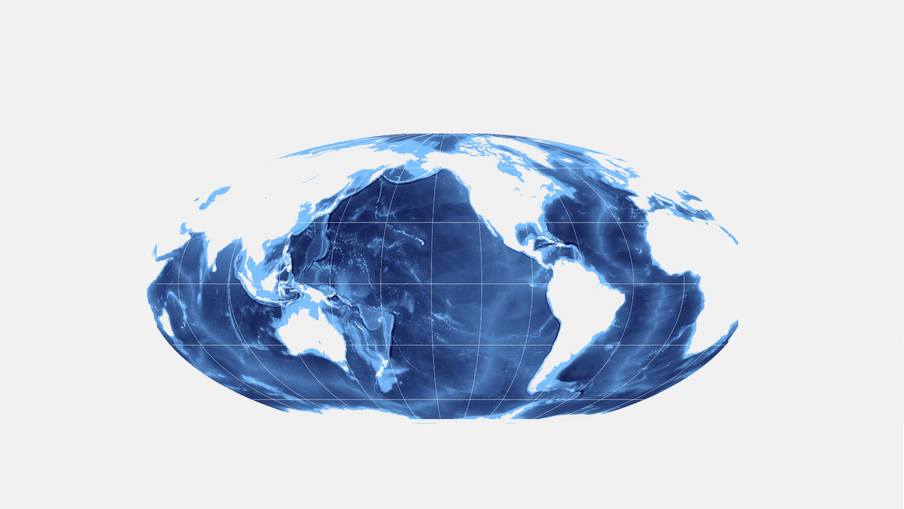
The driving force behind this developing map: British geologist Jamie McMichael-Phillips. When I call him on Zoom, the first thing I notice is the gigantic map of the world behind him. All in black, with the Pacific Ocean in the middle, and a few tiny white dots. “Those are the locations we’ve already mapped,” he says.
McMichael-Phillips, project director of the Seabed 2030 Project, aims to map the entire ocean by 2030. He and a large group of scientists are trying to collect as much bathymetric data as possible about the ocean floor. “There’s still over 290m sq km to discover,” he says. For your reference: the Earth’s total surface area is 510m sq km.
For hundreds of years, cartographers have been working hard to map our planet. Where are the mountains? Where are the deserts? Where are the inhabited areas? Halfway through the last century, the process sped up dramatically, when we shot the first satellites into space.
To accurately determine the terrain of the Earth’s surface, satellites send beams of electromagnetic radiation (ie, light waves) at the Earth. Then they measure how long it takes for the light waves to be reflected back. Based on that data, it is possible to calculate the elevation of the terrain: how high or low the surface is.
For hundreds of years, cartographers have been working hard to map our planet
Unfortunately, this technique does not work in the deep sea. In the ocean, the projected electromagnetic radiation doesn’t get farther than a few dozen metres below the surface of the water.
Yet when you look at a world map, you will often see different shades of blue in the ocean. These colour variations are estimated mountain ranges, based on satellite predictions. Many of these mountains have never really been measured in detail.
An example: the average depth of the ocean is 3.9km. At that depth, current topographical techniques can only map the ocean floor at a maximum resolution of about eight by eight kilometres per pixel. For comparison: that’s half a pixel for the city centre of Amsterdam. And four pixels for all of Greater London.
That’s not nearly detailed enough to predict melting glaciers or forecast the direction of tidal waves. But there are techniques that do make that possible.
The deeper you get, the more difficult it becomes
In the course of his research, Jakobsson uses a technique that has been around for decades: sonar. This maps what is known as the bathymetry: the terrain of the ocean floor.
Sonar (sound navigation ranging) consists of sound waves that vary in frequency. Sonar can produce a high squeal known as a chirp. That sound is used by ships to navigate, or to detect other objects in the ocean, for example. The chirp technique has been used to enhance the signal-to-noise ratio, which enhances the ability to map the deepest parts of the ocean.
The sonar device emits a single pulse of sound, then waits until the sound is reflected off objects on the seabed, and is again detected by the device. “We use that to determine the shape and distance of shipwrecks, hills, mountains, you name it,” Jakobsson says. “Bit by bit, that’s how we assemble a map of the ocean.”
It is a technique that has already led to many discoveries. In 1957, English geologists Marie Tharp and Bruce Heezen were the first to make a rough map of the Atlantic Ocean using this method, thus discovering the groundbreaking theory of plate tectonics. They had a few echo sounding depth profiles that crossed the Atlantic, and painted a picture of the shape of the seafloor in between these profiles using geological assumptions.
The single beam echo sounding technique only provides a string of depths right below the ship.
That’s why multi-beam sonar techniques began to be used in the 1970s. “This means that we’re not looking at one specific point, but at a larger area,” Jakobsson explains. “A supercomputer uses this data to produce an overall picture of the seabed, without having to merge all those points yourself.”
But there are depths at which even dual-beam sonar cannot provide an accurate image of the ocean floor. Deeper depths are simply not possible to map at the same resolution as shallower depths. Together with his fellow oceanographers, Jakobsson has therefore determined a minimum standard for map quality. For example, each pixel between 0 and 1,500 metres deep must be 100 by 100 metres. For deeper zones, the standards are less demanding: each pixel between 5,750 and 11,000 metres deep only has to be 800 by 800 metres. “In all cases, it’s a lot more detailed than the data we have now,” Jakobsson says.
Everything and everyone can help
So all that’s left to figure out is: who will collect all the data?
Even if all the oceanographers in the world were recruited to help out, 2030 would probably still be too ambitious to complete the seabed map. That’s why his organisation relies on the hundreds of ships that already sail the ocean every day. Pleasure craft, research vessels, container ships, exploratory vessels operated by oil companies checking out a new area, or deep-sea miners: as long as sonar is used and the resulting data is saved, it can be used for the project.
McMichael-Phillips does have to get permission to use the data. Information about the seabed can sometimes be confidential, for example if national or commercial interests are involved. And all the data collected by the Seabed 2030 Project is shared with the public.
Since the project is so dependent on different people and parties, it is important that the data is reliable. “When we receive data from external sources, we always compare it with the rough satellite data that we already know,” Jakobsson says.
“If it’s a match, then it’s probably reliable.” The researchers also look at whether there are major differences in relation to nearby locations that have already been mapped with sonar. If one sounding shows a tall mountain, and the other shows a deep valley, then something has gone wrong. In that case, the soundings need to be repeated.
The downside of a complete and detailed ocean floor map
But there is also a downside to this whole story: once the ocean floor is fully mapped, it will be much easier for deep-sea miners to see exactly where natural resources are located. For example, it is an established fact that valleys contain more minerals than can be found in the peaks of underwater mountain ranges. Once this information is available, it will be much easier and faster for the industry to move in and start mining.
And how about oil companies? It will suddenly be possible for them to just choose a location for an oil drilling platform, without first having to explore for years to find a suitable location. Locations where oil can be found below the seabed will be in great demand. Is that a good thing?
Jakobsson is realistic: “Our findings can certainly be misused. But is that a reason to discontinue research if the benefits outweigh the risks many times over? Transparency is important and the more we know about the oceans, the better we can be in making sure that exploration of resources is done with environmental care.”
And besides: “Mankind is still too dependent on fossil resources. Resolving that problem will really require pushing other buttons. And who knows, understanding the oceans can perhaps be a part of the solution. The key is to make sure that we undertake a sustainable use of the oceans, seas and marine resources and not exploit this part of the planet without care.”
Translated from the Dutch by Joy Phillips.
 About the images
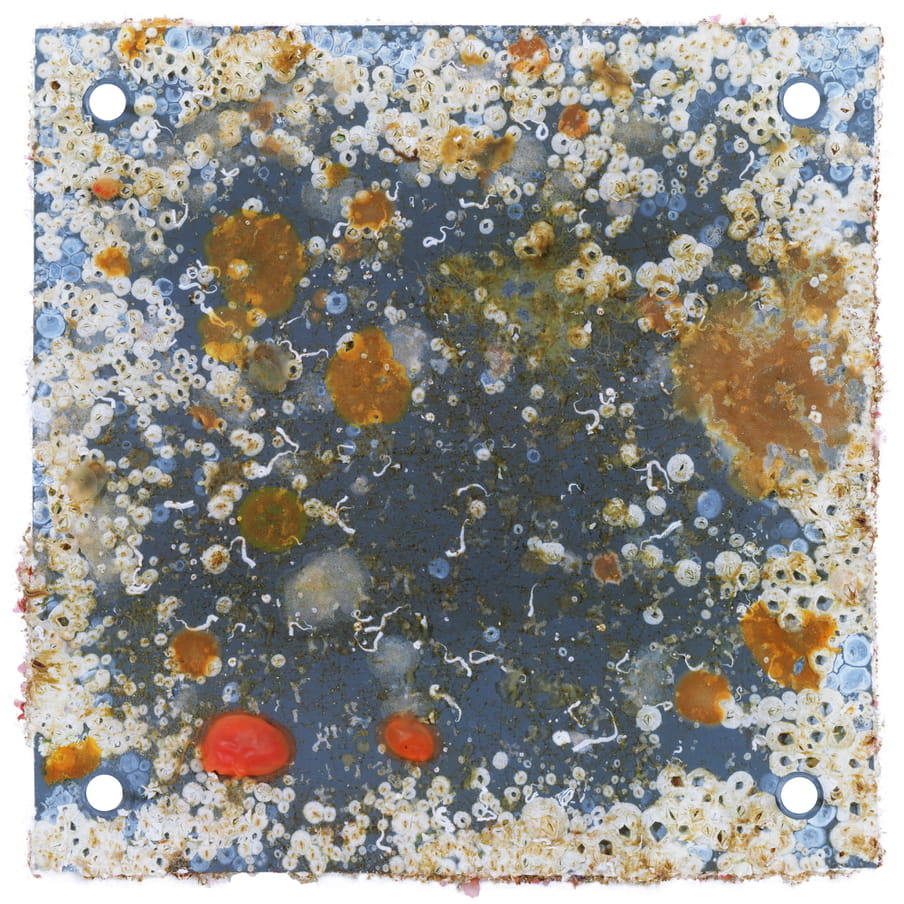
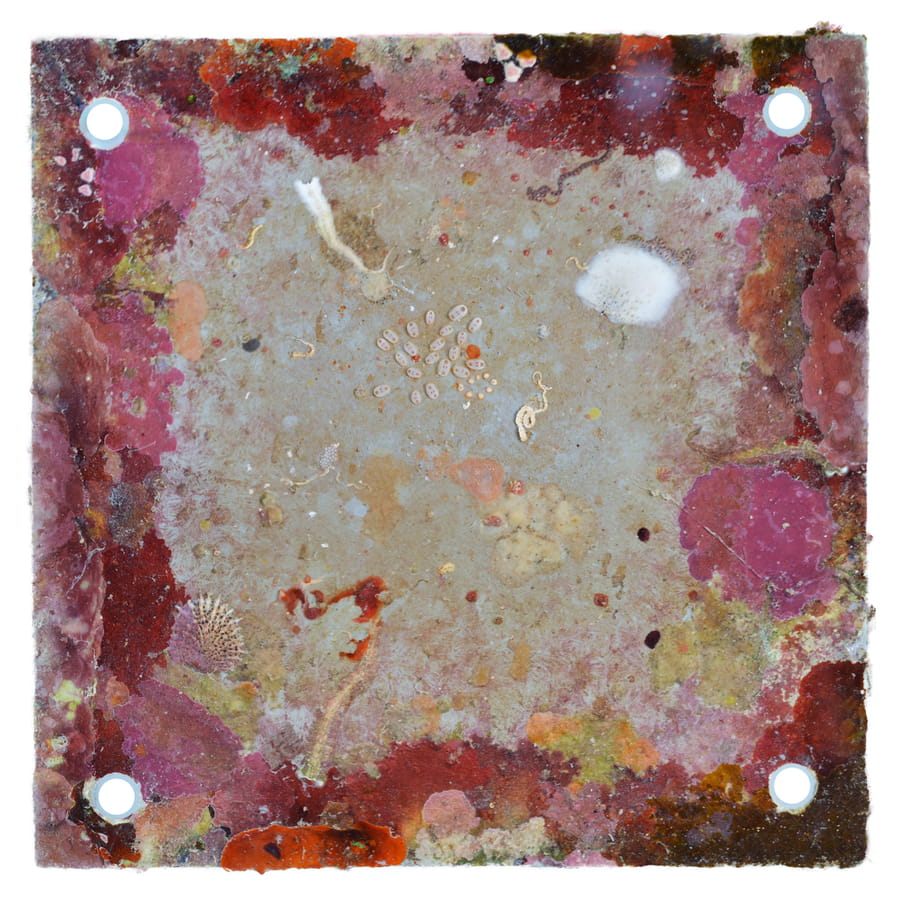
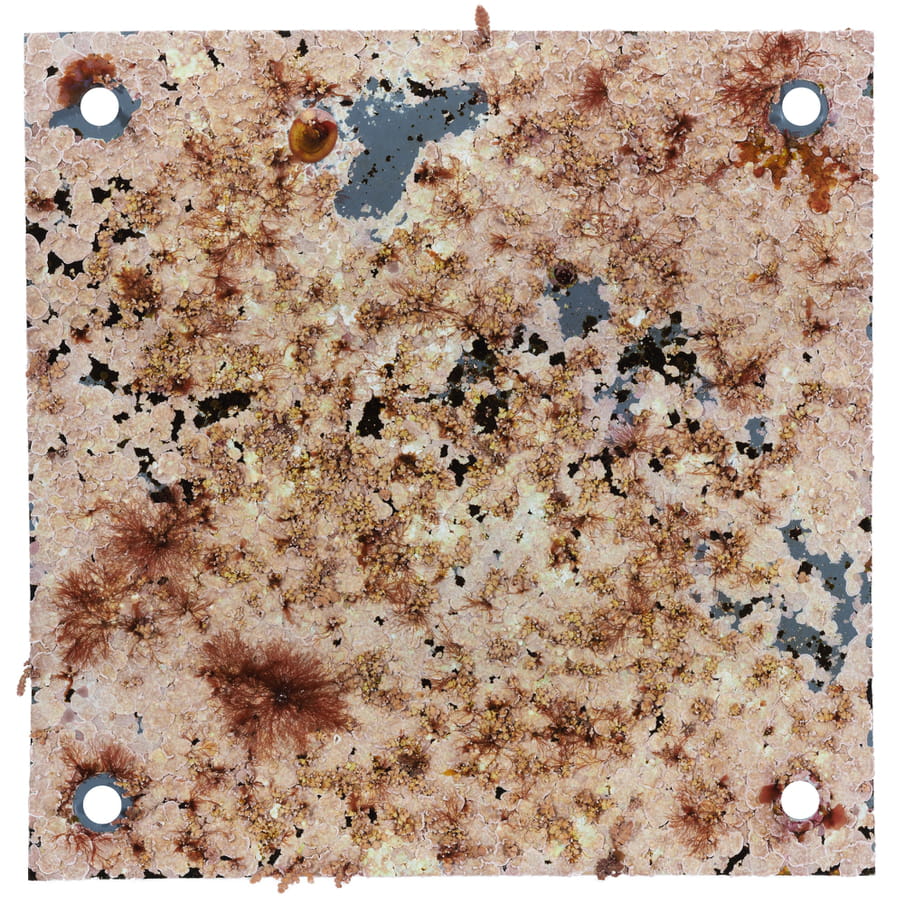
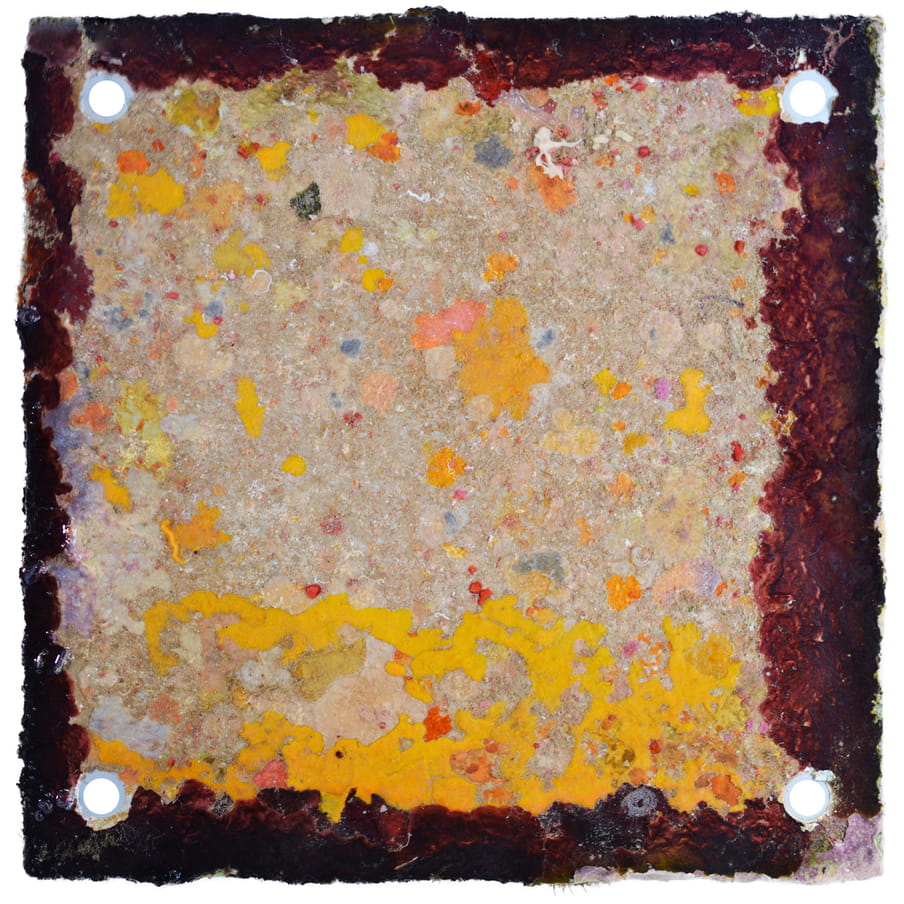
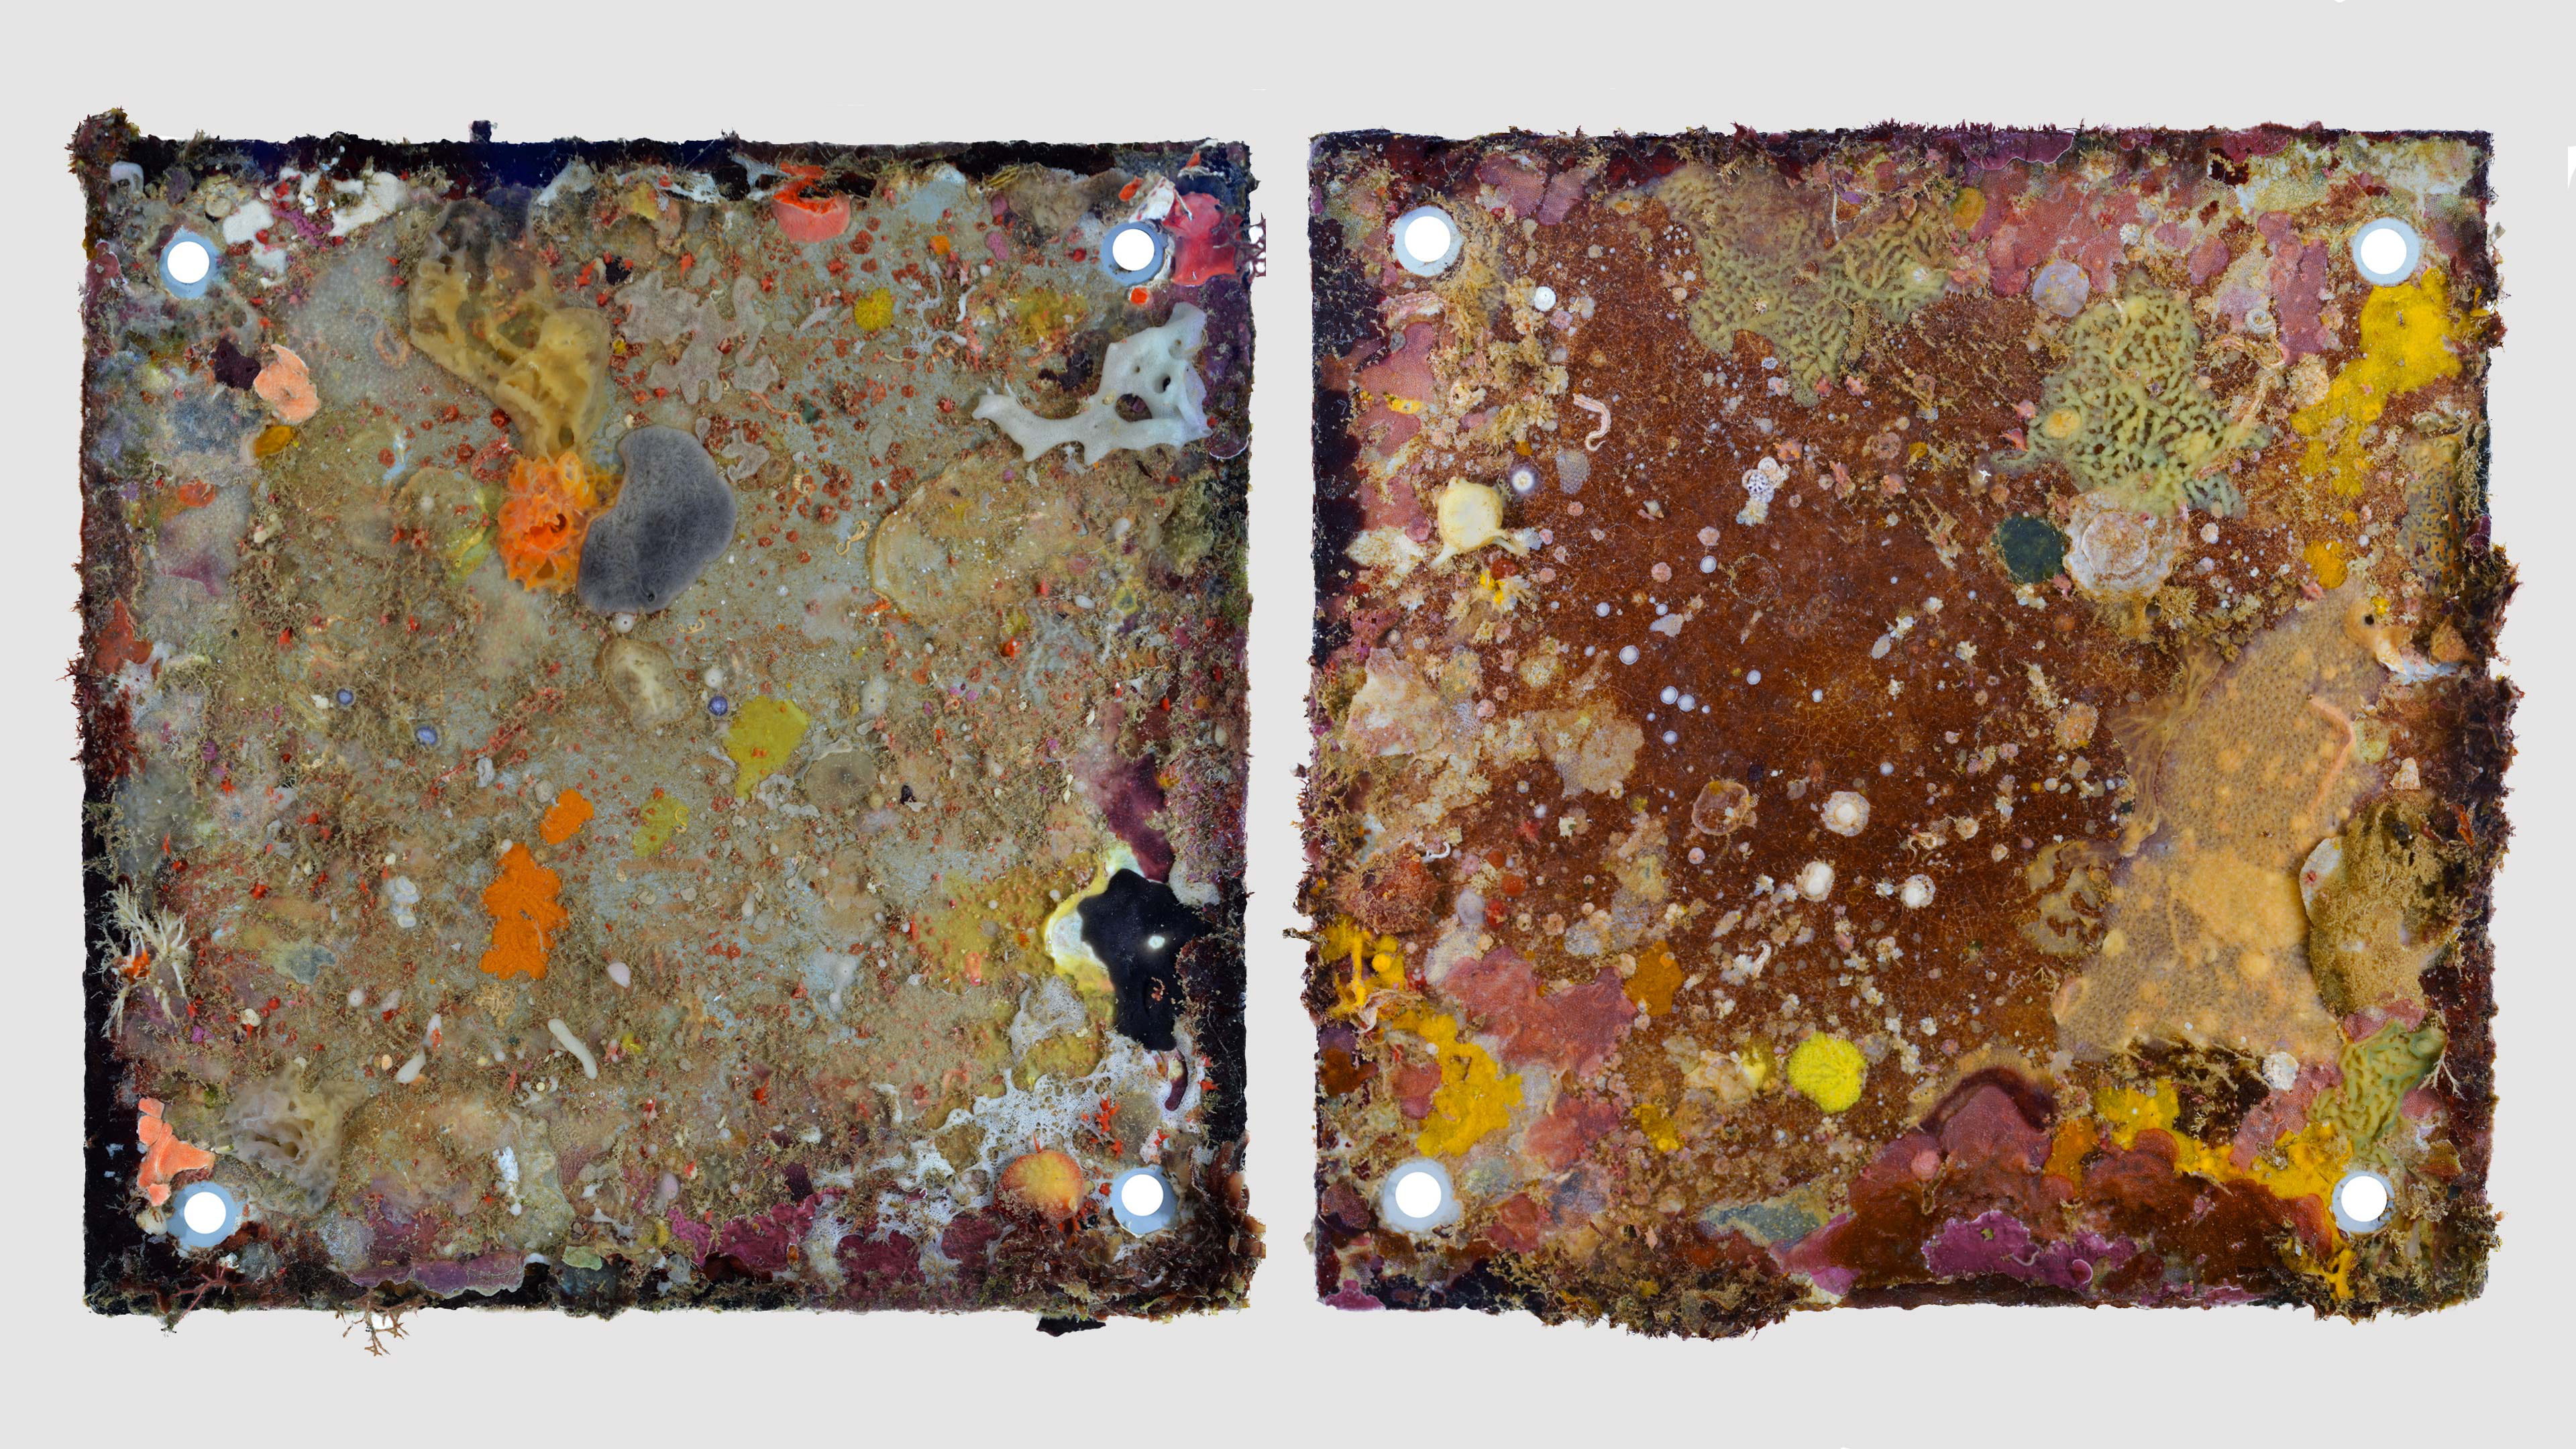
At first sight, the little panels in the pictures might resemble the abstract expressionist paintings we usually see on the walls of the MoMA or the Met. In reality, they are Autonomous Reef Monitoring Structures (ARMS), measuring 20 by 20cm, located in clusters around the world, from the poles to the tropics, to the deep sea. They are used to measure the health of the oceans.
About the images
At first sight, the little panels in the pictures might resemble the abstract expressionist paintings we usually see on the walls of the MoMA or the Met. In reality, they are Autonomous Reef Monitoring Structures (ARMS), measuring 20 by 20cm, located in clusters around the world, from the poles to the tropics, to the deep sea. They are used to measure the health of the oceans. They act as marine life mini-villages and the patterns, shapes and colours on the panels are created by marine flora and fauna nestling on them. Todd Forsgren photographed these panels after they were taken out of the water for research. By keeping track of what grows and lives, we learn more and more about the impact of environmental factors on marine life.
Dig deeper
 We don’t really know what’s living in the deep sea – but it’s about to become an industrial zone
The latest gold rush is driving miners to the bottom of the sea. It may seem like a great alternative to sourcing rare-earth minerals for batteries and computer chips – but we don’t really know what’s living so deep beneath the ocean waves, or whether those lifeforms will survive such mining practices.
We don’t really know what’s living in the deep sea – but it’s about to become an industrial zone
The latest gold rush is driving miners to the bottom of the sea. It may seem like a great alternative to sourcing rare-earth minerals for batteries and computer chips – but we don’t really know what’s living so deep beneath the ocean waves, or whether those lifeforms will survive such mining practices.