

It was 1633. In the German village of Oberammergau, the dead were piling up. Whereas one in 1,000 inhabitants had died every month the previous year, that year’s death toll rose to 20 in 1,000. The bubonic plague was ruthlessly sweeping through southern Germany.
The villagers had a bright idea: what if they promised God that they would perform a play about the life of Jesus every 10 years? Praying earnestly, they pledged to organise a passion play once a decade from that year on for eternity.
After their fervent prayers, not a single person came down with the plague. The villagers who already had it all recovered. What a miracle! Their prayers of promise had worked. The first Oberammergau Passion Play took place in 1634.
Flawed thinking in the face of epidemics
The Oberammergau Passion Play is still performed every 10 years. Its genesis has become a local legend. It’s difficult to determine exactly how it all got started, but it shows how easy it is to embrace a logical fallacy or misconception, especially in uncertain times.
It may be true that no one died of the plague after the village prayed. It is extremely unlikely that no one died because they prayed. It’s a classic example of confusing correlation and causation.
The German villagers’ particular error isn’t likely to trip you up today, but that doesn’t mean no logical fallacies can take hold nearly four centuries later. Right now, in the age of coronavirus, we see all sorts of errors involving numbers or logic almost daily.
Take this headline from the Financial Times: "Coronavirus may have infected half of the UK population – Oxford study". The article claims that a new epidemiological model indicates that the vast majority of people who are infected may not even notice they have the disease. The article alleges half of the British population may already have had coronavirus, most without noticing it. The claim feeds right into the favourite theories of people who think social distancing measures are exaggerated.
But if we actually take a look at what the Oxford study is based on, it’s immediately clear the calculation was a theoretical exercise. The scientists were investigating how sensitive the outcome of an epidemiological model would be to different assumptions. An important variable in the model: rho – the percentage of the population that will become seriously ill.
If they assume that rho equals 0.1% – only one in a 1,000 people infected becomes seriously ill – then that would mean, according to the model, that 68% of the British population have already had Covid-19. Even though the hospitals may be full, there would also be a very large group that has had the virus without noticing it.
But ... that depends entirely on the assumption on which this oversimplified model is based. If rho is higher, the projections look a lot less positive. And we don’t know exactly what the value of rho is because we would have to test more extensively for the virus to identify it. As the report’s lead author said himself: “These are not forecasts.”
I previously wrote about the key numbers in the conversation around coronavirus. Today, I want to delve deeper into the interpretation of those figures – and especially what can go wrong in that process.
You don’t have to be an epidemiologist to pick out the complete nonsense in the flood of reports and stories being posted. As science journalist Hans van Maanen once wrote: “We may not be able to lay an egg, but sometimes we can smell if it’s rotten.”
These three mistakes cropped up frequently in the last few weeks – and you’re sure to run into them again in the near future.

1. Cherry picking
In the Netherlands, where I’m based, this table comparing the mortality trend in Italy did the rounds on the internet. The underlying message: the Netherlands is heading in the same direction as Italy! Sure, if you just look at those two columns of figures, they do seem frighteningly similar.
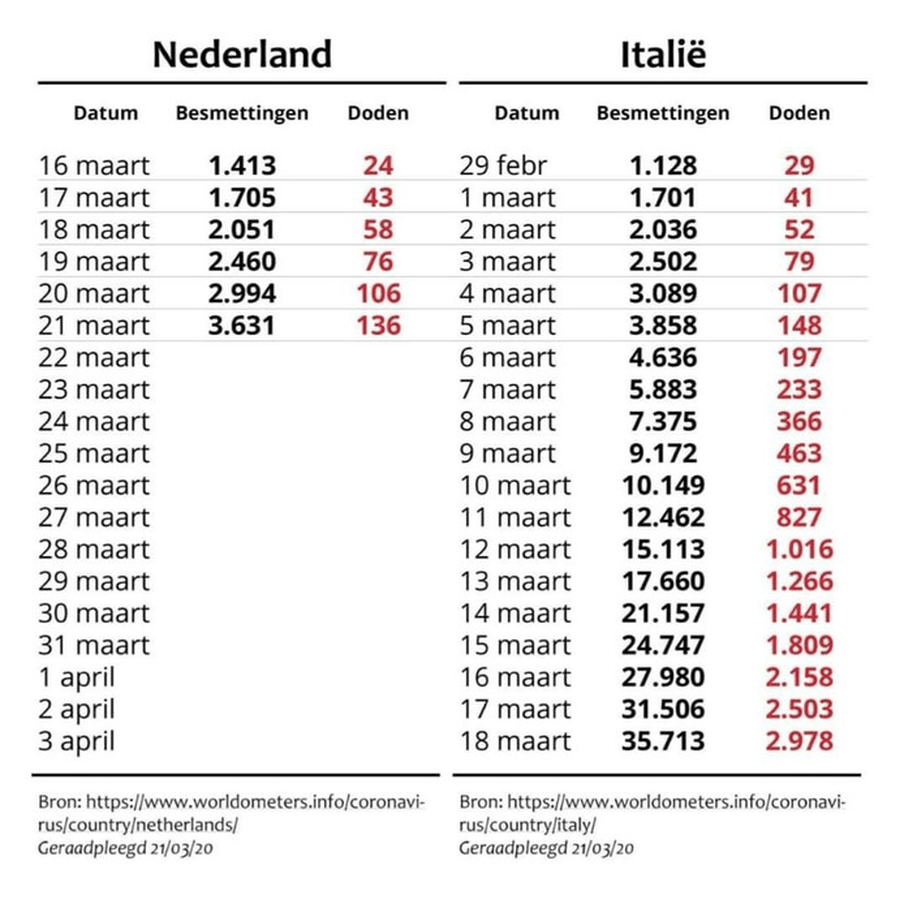
But it depends on exactly when you start counting. Why does this table start counting on 16 March in the Netherlands and on 29 February in Italy?
The mortality rate isn’t counted on the same dates for both countries. This makes sense: the first coronavirus case in Italy was detected on 31 January, whereas the Netherlands only found its first case on 27 February. The first Italian patient died on 21 February; the first Dutch person died from coronavirus on 6 March.
So when do you start counting? The table opts for 16 March for the Netherlands, but that seems a bit random – that’s 18 days after the first confirmed case, and 10 days after the first death from Covid-19. Using 29 February for Italy seems just as arbitrary: 29 days since the first confirmed case and eight days since the first death.
The table is a prime example of cherrypicking – selecting and massaging data so it fits your argument perfectly.
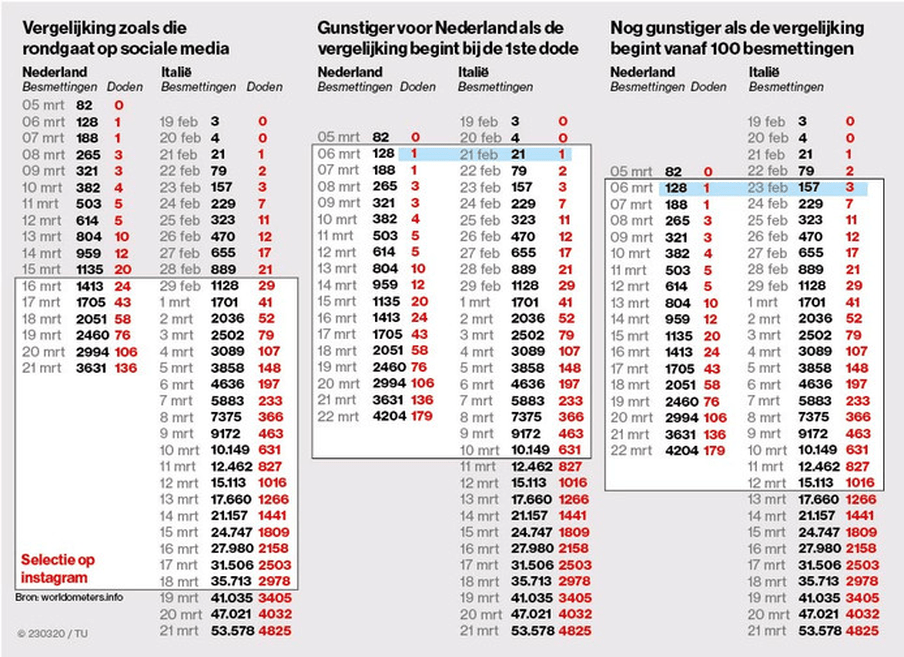
But it really depends on exactly when you start counting. The Dutch newspaper Algemeen Dagblad showed that the situation in the Netherlands looks better – in absolute numbers – when you start counting from the first death, which would seem like a more logical starting point. And the comparison is even more positive if you don’t start counting until the 100th infection. This table shows what happens if we shift the columns around.

2. Comparing apples and oranges
This table isn’t the only comparison between countries. We’re all keeping a close eye on developments in Asia, and some say Sweden shows a lockdown isn’t the only solution.
As tempting as they may seem, we need to be cautious about making comparisons. The next logical fallacy lies in wait: comparing apples and oranges. That means pretending that two situations are similar, even though there are differences that make that impossible.
Let’s look at Italy and the Netherlands. First of all, the two countries have different demographics. Italy has relatively more people over 65, which is exactly the group that runs the highest risk of dying from the coronavirus.
Italy also rolled out measures differently than the Netherlands. In the Netherlands, the government decided on 12 March that events of over 100 people were banned, that people with mild symptoms had to stay at home, and that everyone had to work from home wherever possible. That was just five days after the first death. Three days later, even stricter measures were imposed, including closing all schools, gyms, bars and restaurants. Italy closed on 9 March, 17 days after the first death. But the country has imposed much stricter measures by now – for example, by locking down much of its production.
Another factor that could play a role here: it’s fairly common in Italy for a single household to include several generations. Italians between the ages of 30 and 50 are relatively likely to be living with their parents – one study indicated that over 20% of that age bracket shared a household with their parents in Italy, compared to less than 5% in the Netherlands. Since the elderly are particularly vulnerable to corona, this can pose an additional risk.
The list of differences between the two countries continues: a different healthcare system, a different method of counting, a different overall level of health. The actual significance of all these factors is still just speculation. But unless you can rule out their influence, it’s hard to come up with a valid comparison. That doesn’t mean the Netherlands is absolutely not following in Italy’s footsteps – but a simple table doesn’t offer enough evidence one way or another.
Another tempting comparison: Covid-19 and the flu.
Donald Trump did this on 27 February: "I want you to understand something that shocked me when I saw it, that I spoke with Dr. Fauci on this, and I was really amazed, and I think most people were amazed to hear it. The flu in our country kills from 25,000 people to 69,000 people a year. That was shocking to me."
The US last saw a major outbreak of influenza in 2018. It’s important to put the current situation into perspective, of course. Aren’t we going a bit overboard with all these precautions? But again, the two situations can’t really be compared.
To start with, Sars-CoV-2 – the virus that causes Covid-19 – is different from the influenza viruses that cause the seasonal flu. Where flu often affects children (as well as the elderly), the coronavirus seems to hardly make them sick. Covid-19 also seems to cause more severe symptoms than flu, appears to be more contagious, and takes longer to show symptoms. And we’re dealing with a completely new virus here, so there’s no vaccine yet and no one has built up natural immunity.
But there’s another reason why this is comparing apples and oranges: the flu epidemic of 2018 is over and done, but the coronavirus pandemic is still surging. We don’t know yet what kind of figures we will eventually have to compare because we don’t really know what the future will look like.
"We don’t know this virus," said Dr Bruce Alyward, leader of the World Health Organization’s joint mission with China on Covid-19. "We don’t know what’s going to happen next."

3. False sense of security
Daily updates show the latest figures on the coronavirus pandemic. Front-page in the newspapers, alerts from your news app, the latest press release from the public health authorities – every day brings a fresh look at how many new cases have been confirmed and how many people have died. You can even follow the fluctuating figures around the world live on YouTube.
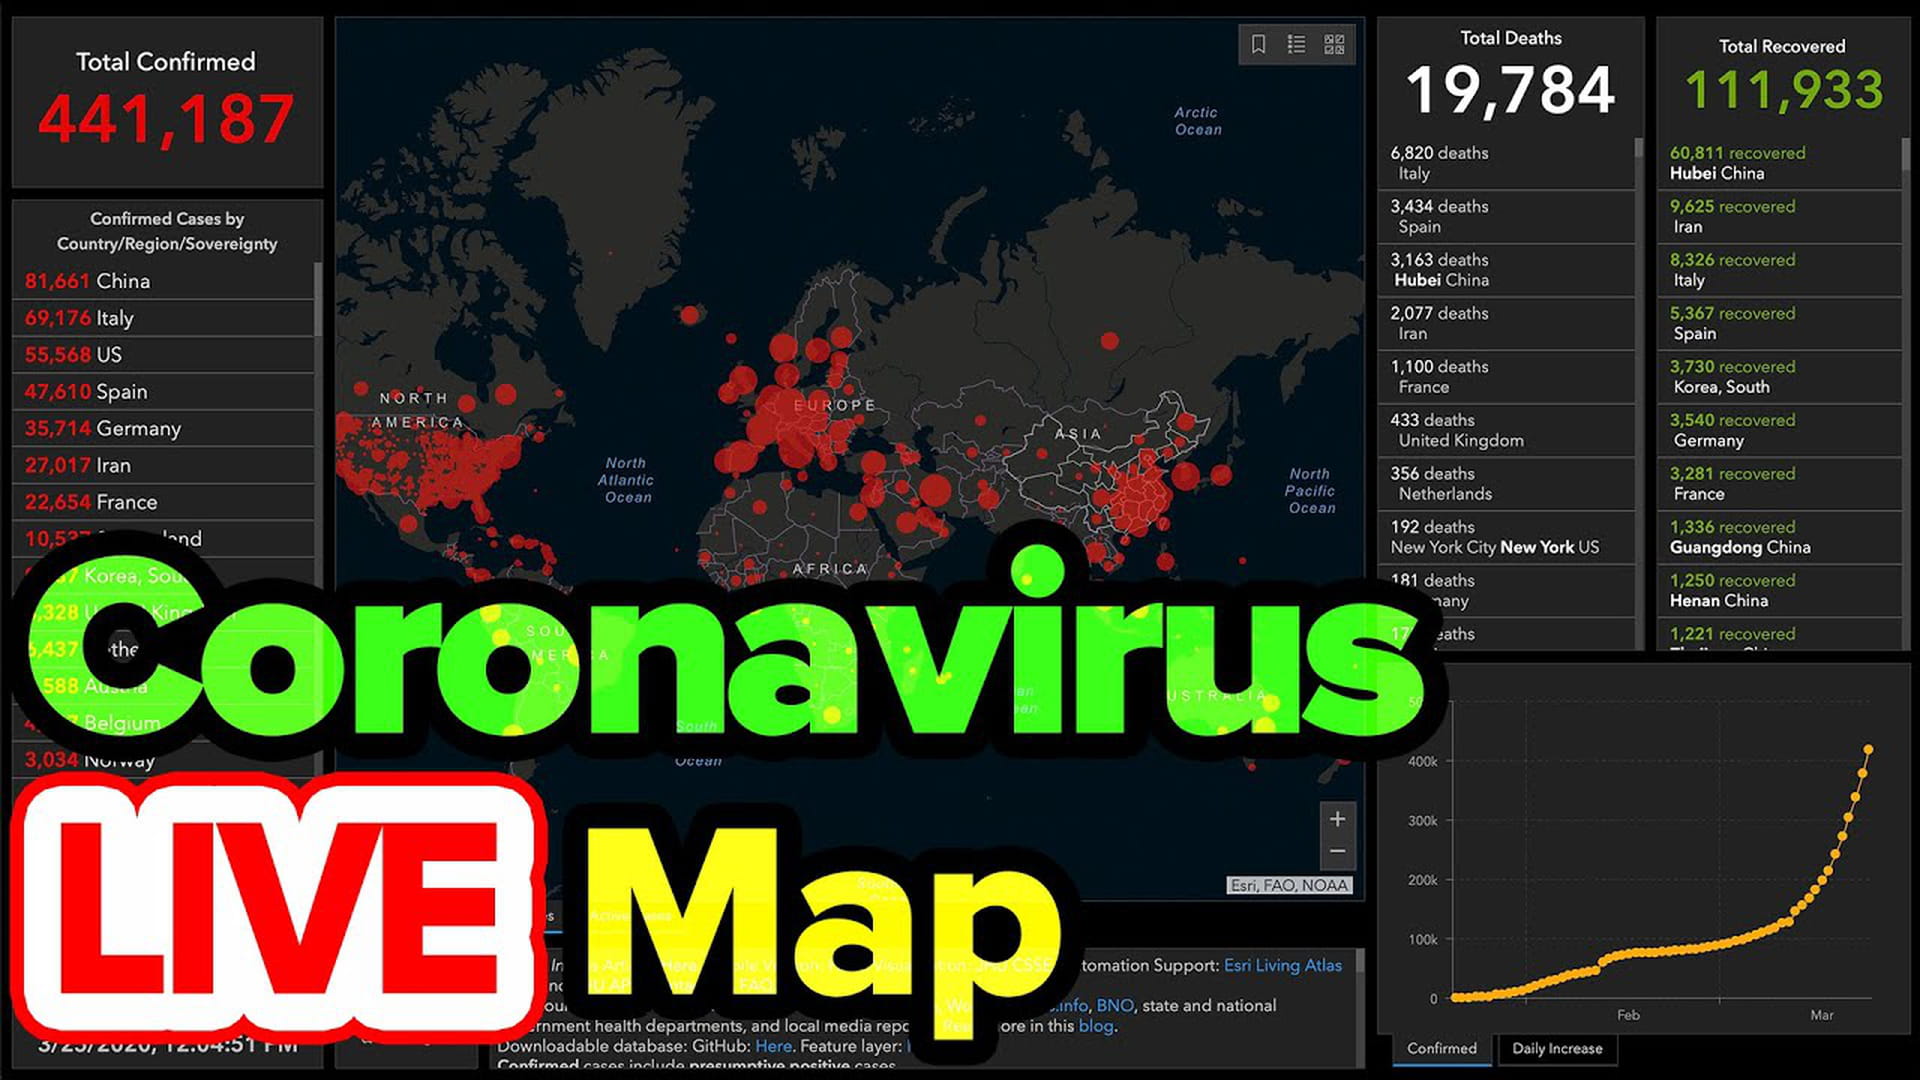
But the precision of those figures is misleading. Let’s look at the number of confirmed cases. We simply don’t know how many people are infected because not everyone is being tested – far from it. If you have mild symptoms, which is quite possible with Covid-19, you don’t even have to call the doctor in many countries. Tests are administered with caution because there are not enough tests to go around. So we only know about the confirmed cases.
The figures on deaths can also be disputed to some extent. In any case, it’s important to realise that it sometimes takes a while before the municipal public health services notify the national authorities that someone has died. That means that a coronavirus-related death may not show up in the figures until a few days later.
But there’s another problem with these mortality rates: a case is only counted towards the pandemic figures if the person who died has in fact tested positive for Covid-19. For example, there are concerns that China and Italy are underestimating the actual number of deaths.
It could be even worse. The first cases of Covid-19 were reported in Iran on 20 February. But... those confirmed cases were immediately also reported as deaths. That’s odd because it takes at least a few weeks before infection with the novel coronavirus leads to death. So the logical conclusion must be that the virus had been in the country for some time, and the number of cases was much higher than the official figures had reported . Was that deliberate intent, clumsiness, or simply a lack of capacity? We may never know.
In the best-case scenario, you may need to take the official figures with a huge grain of salt; worst-case, maybe you shouldn’t trust them at all.
So what can we say, then?
It’s all frustrating, obviously. We all want something we can count on; we want to understand what’s going on.
Eventually, we hope to see less uncertainty in the data at our disposal. By testing more, and not just when there’s a direct medical reason for testing. That will help us see who is sick (or has already had the virus), how serious the virus is and how contagious it can be, and how those aspects correlate to factors like age.
Until then, we have to look at the figures as a general indication. And the next Oberammergau Passion Play? It was planned for 2020, but had to be cancelled. Because of corona.
My thanks to Floris van Proosdij, who told me about the example of Oberammergau. And to Jaime Borjas, who read this with an expert eye.
Translated by Joy Phillips.
 Deciphering the pandemic: a guide to understanding the coronavirus numbers
You’ve already read countless articles on coronavirus infection numbers. But what do those numbers really mean, and how should you read them?
Deciphering the pandemic: a guide to understanding the coronavirus numbers
You’ve already read countless articles on coronavirus infection numbers. But what do those numbers really mean, and how should you read them?