
It’s like one of those optical illusions: it looks like one face at first, but it’s actually two. Once you see the second face, you can never unsee it.
In this case, the illusion is how we view migration – it’s the maps we see so frequently that visualise migration for us.
These maps are everywhere. Here on The Correspondent, in textbooks, on the news and in policy documents. Maps that show arrows pointing towards Europe, representing irregular migrants on their way to the EU.
Those maps may look informative and factual, but are actually anything but neutral. In fact, they subconsciously strengthen the ugly underbelly of anti-migration sentiments in Europe.
Far more than we realise, the maps dictate the opinions and emotions that we form about migration. How is that possible? And above all, is there a better way to do it?
We – professor of political geography Henk van Houtum, designer Leon de Korte and correspondent Maite Vermeulen – decided to take a stab at answering that question. In words, but first and foremost in images. Because once you see it, you can never unsee it.
Why we often think maps are neutral
Let’s start with some Cartography 101.
Whether we’re talking about wars, climate change or inequality, chances are that a map will help us understand the world’s important themes at a glance.
Since maps often do not have a clear author and generally use simple icons, they give us a sense of objectivity. They exude an impression of general knowledge and common sense. We see them as reliable summaries, overviews of how the world works.
The exact opposite is true. Every map contains inherent choices. What information are we compiling, why, what do we show and what do we leave out, what shapes, colours, projections and sizes do we use? There is no such thing as an objective or neutral map. Every map projects its own worldview.
There is no such thing as an objective or neutral map
A classic example is the size of Africa as shown on the standard world map: the continent seems quite small, about the same size as Greenland. But in reality, Greenland fits inside Africa more than 14 times. The projection of Africa as a small continent was once, when western geographers set the standards, a technical and political choice.
Maps always project a specific view of reality. They can never be more than a model of the world. This simple fact is inevitable. And it’s not a bad thing, as such. The more maps there are, the greater the sum total of information becomes – just as a multitude of voices blends into a democracy.
Where does it go wrong? When maps are interpreted as neutral truth. Not one of many representations of reality, but the single definitive model of how the world works. And that is exactly what happens with many maps in the politicised migration debate.
The best-known migration map
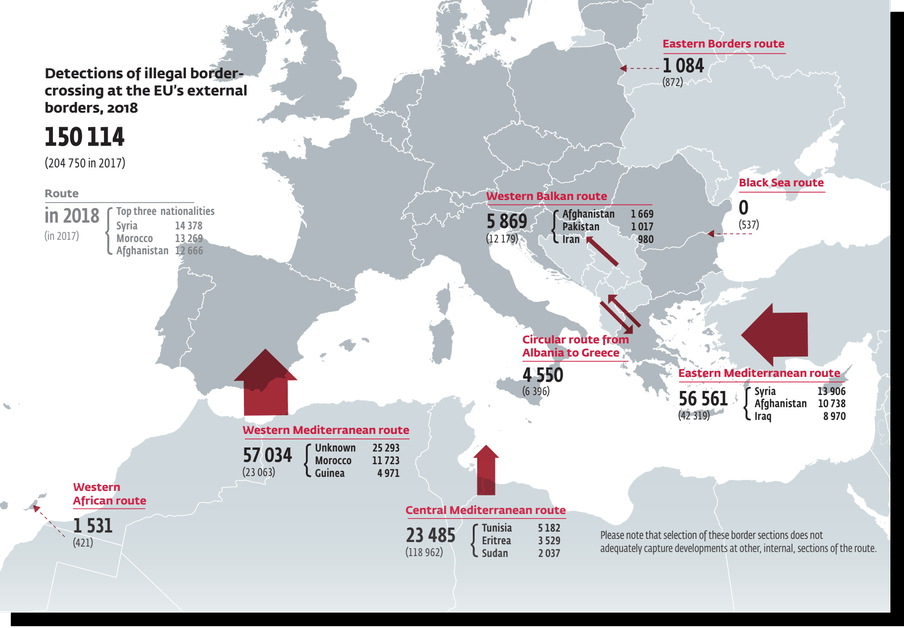
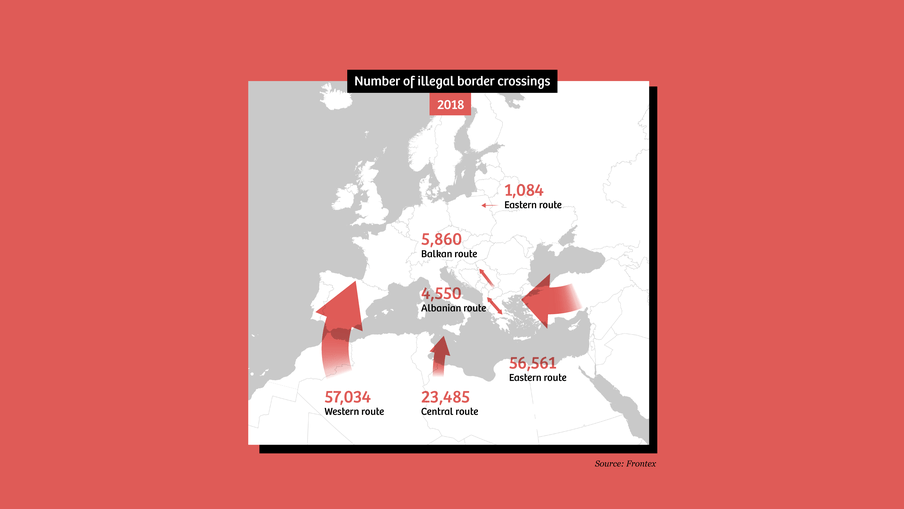
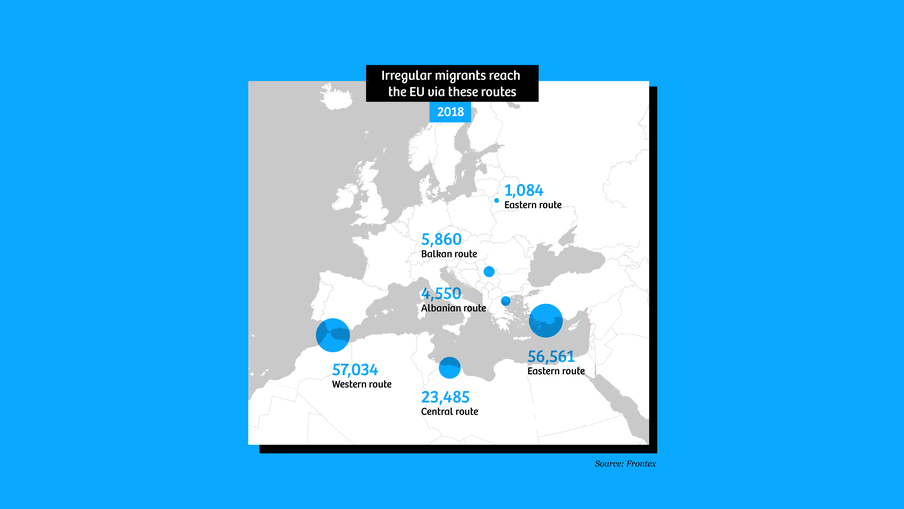
To understand what we see – and what we don’t see – when we look at an average migration map, let’s start by looking at what may well be the most widely copied migration map available: the map published by the European Border and Coast Guard Agency, also known as Frontex, which displays the “illegal border crossings” that the agency registered.
This map is frequently used by European news outlets to depict migration towards the EU.
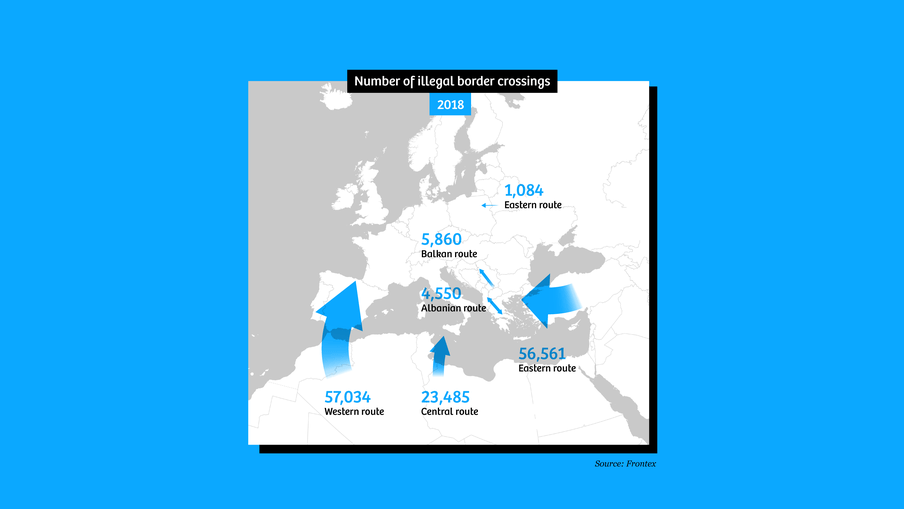
So what’s going on here if we take a look at this map? If we were to redesign the map in the default style used by The Correspondent, it might look something like this:


Is there a different way to do this?
Long story short, the migration map provided by Frontex makes us feel like we are being overrun by huge numbers of anonymous enemies, coming at us en masse from all corners of the globe to disrupt our orderly lives. There are obvious reasons why anti-migration parties, like the Dutch Party for Freedom (Partij voor de Vrijheid), use exactly the same logic on maps that are incorporated into their ads. But is there any other way to do this?
There are movements such as deep mapping, counter mapping, and mobile mapping, which create interesting alternatives. What if you had migrants draw their own map of their journeys, for instance? What if you showed conflicts rather than migration? Or if you added another dimension to the maps by incorporating images and sounds?
These are all great ideas, but not particularly feasible for an editorial team that has a very short time frame for producing a map to accompany a news story. But what would be feasible? What could we do within those time and budget constraints?
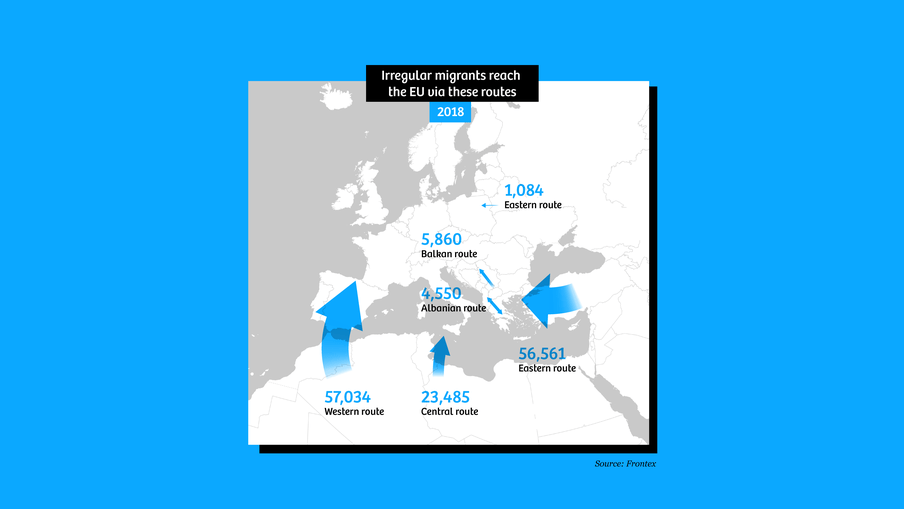
Let’s see what happens when we go back and take another crack at our original migration map.


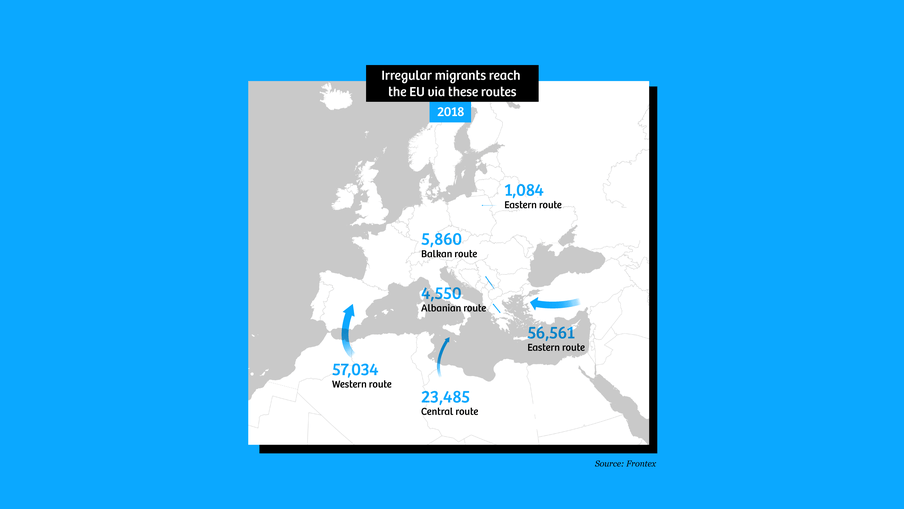

A map may not be the right solution
All right, this map is a lot less alarming than our original design. Still, there’s so much information that’s missing here.
The right to asylum, the Refugee Convention, the horrific conflicts that prompt people to flee, the European contribution to those conflicts, the deaths along our borders – none of that is conveyed here.
And in some sense that’s logical; it’s not possible to avoid simplifying the world in a map. And so the question becomes: are we using the right information?
The only policy response evoked by the Frontex map and its thick, red arrows is: we have to defend ourselves against a major and imminent threat. And when you think about the author of the map, it’s not all that surprising. Frontex’s raison d’être is to guard the European borders. Seen in that light, it seems obvious that the border control authority might come up with maps that are less than objective.
So should we even base a migration map on the Frontex data at all? When Frontex sends out a press release, media don’t just copy/paste its contents without comment, verification or alternative sources – so why do we do exactly that when it comes to maps?
Besides changing the format of the map, it may be even more important to look at what information we should add to put the map in context. And when we do that, it may turn out that a traditional atlas map isn’t the best way to show irregular migration to the EU.


What do you see, and what don’t you see?
These alternatives do give us a different impression of migration across the Mediterranean, that much is certain. It’s also clear that traditional maps may not always be the best format for conveying this information.
As journalists and illustrators, there is no way around simplifying the world for the sake of readability. Whether in maps or in text. But we can be much more aware of the consequences of those simplifications – and be honest about what’s happening. We can present a map as a story that contains moral choices, rather than portraying it as the truth. In any case, the Correspondent shade of red is now banned for migration maps. We’re not going to casually use those big fat arrows anymore, either.
But the most important point here may well be that we need to look at maps differently, as news consumers. We need to ask ourselves what we see, and above all what we don’t see. Every time you see a map used somewhere, take a moment to contemplate who authored this visual story and what message the author wants to convey. And why.
This piece first appeared on De Correspondent. It was translated from the Dutch by Joy Phillips.
Dig deeper
Would you like to read more about these migration maps? Check out ‘The Migration Map Trap’, an academic article by Henk van Houtum and Rodrigo Bueno Lacy that was published recently. What happens to migrants who are sent back? I spent a year following 12 people to find out
We constantly hear about migrants trying to get to Europe but never about what happens to those who are unsuccessful. I followed 12 people after their return from a failed journey.
What happens to migrants who are sent back? I spent a year following 12 people to find out
We constantly hear about migrants trying to get to Europe but never about what happens to those who are unsuccessful. I followed 12 people after their return from a failed journey.